WIDGETS AND TRENDS SECTION
- What is the trends widget?
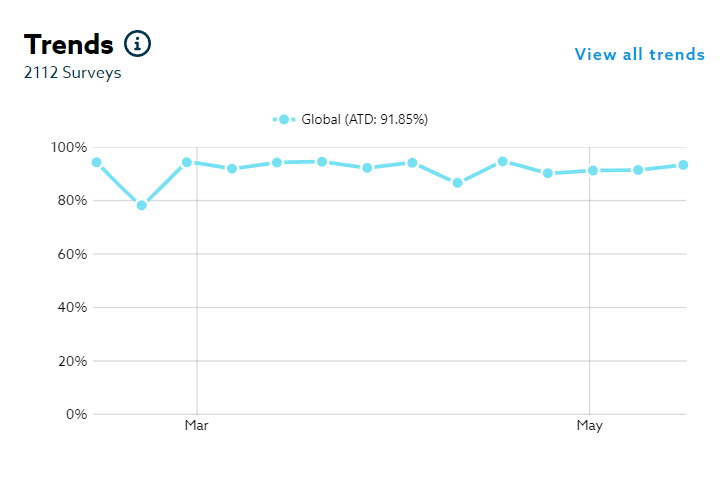
Trends shows the evolution of the indices over time so that you can track the evolution of the overall satisfaction rate over a year, for instance.
With the Trends widget, you can view the evolution of the global satisfaction rate for a selected period. Unlike the Trends tab, it doesn’t allow you to see how other indexes evolve over time. It makes it possible to compare the global satisfaction rate for a selected area with a network.
- What is the Trends ?
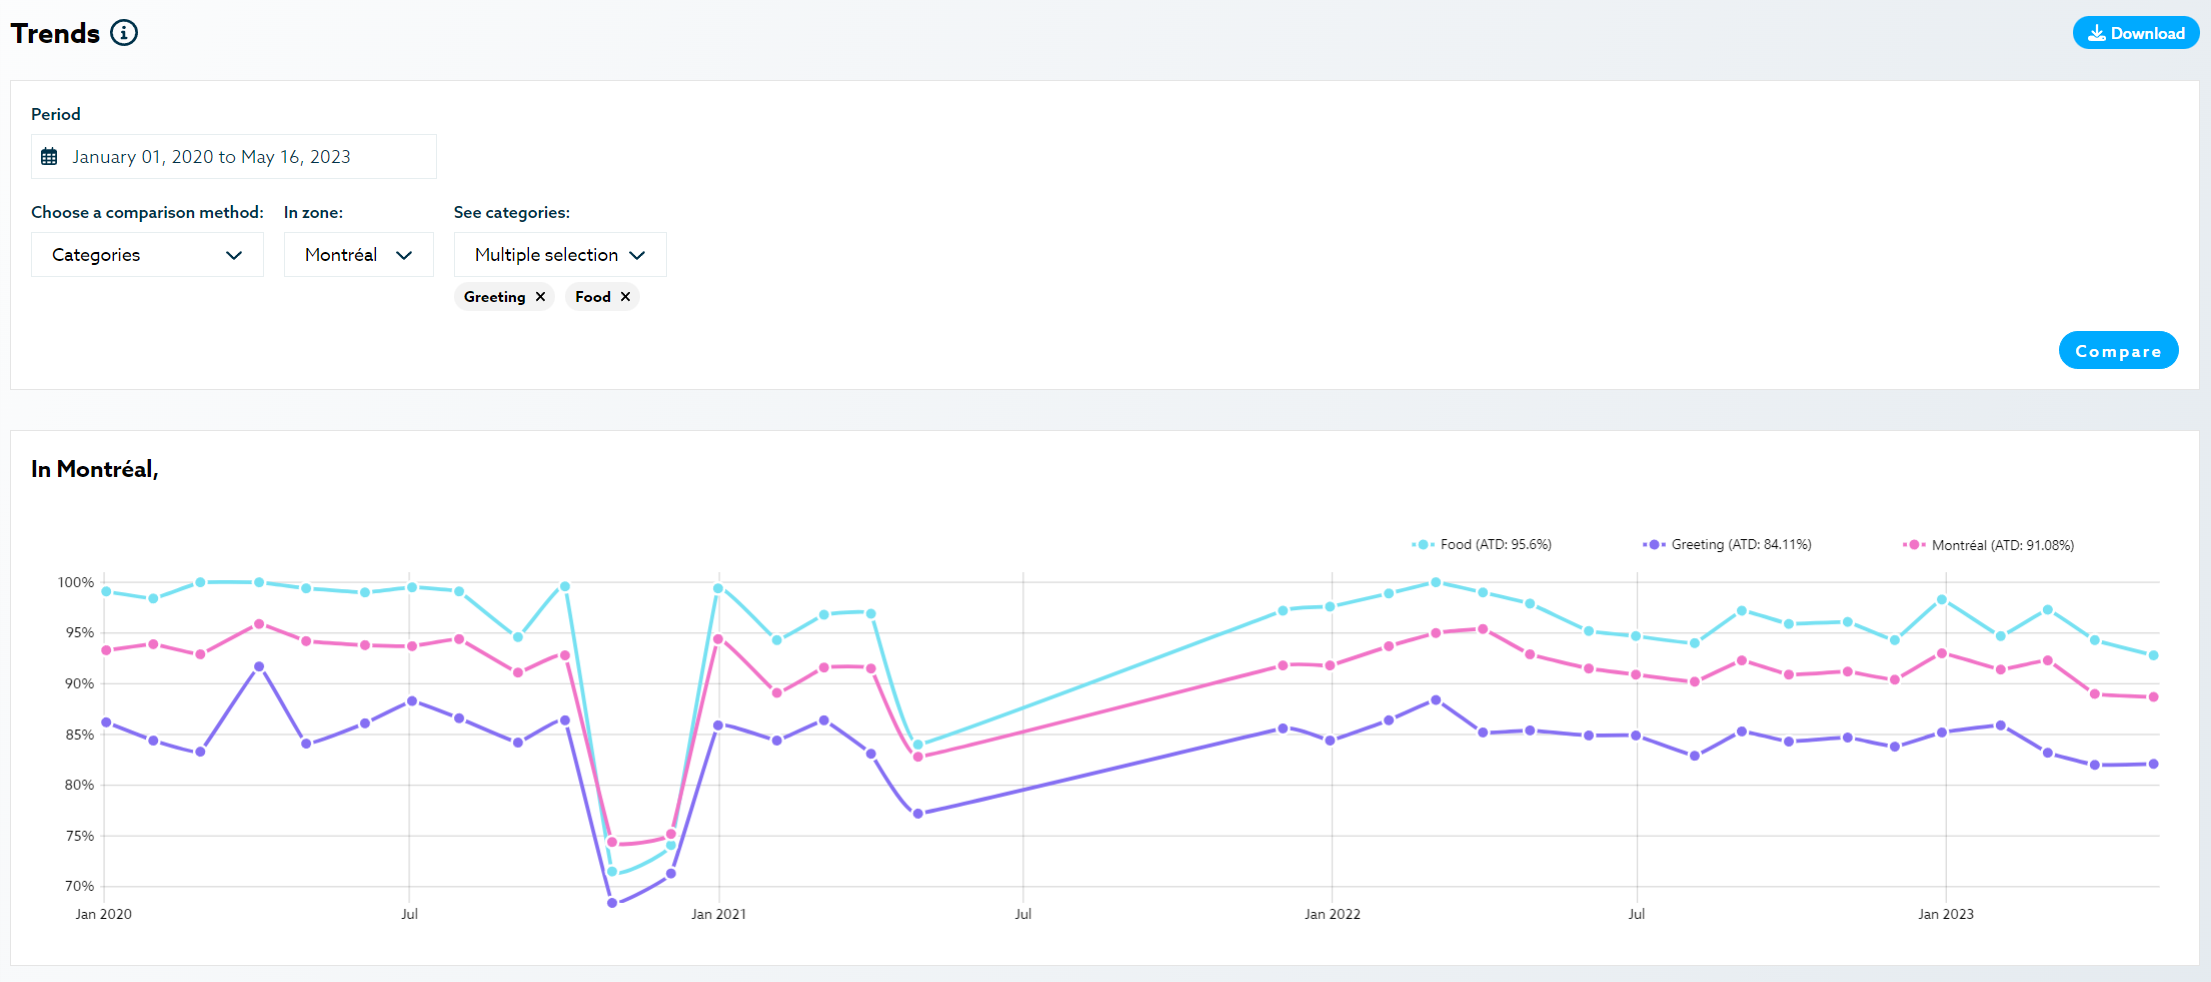
Under the Trends tab, you can create graphs and track the evolution of the results for selected parameters. By default, a simple trend shows you the evolution of the results over time for the selected measurement. You have the option to create a chart to compare categories for a selected area or compare areas to each other for selected categories.
a. What are the results based on?
Multiple filters allow you to target the index you want to view more precisely, such as province, sector, period, and so forth. Each of the points in the graph represents the average of all scores obtained during that period out of 100. Therefore, the result will vary between 0 and 100. The closer the score is to 100, the higher the level of satisfaction of your customers.
b. How do I use the Trends tab in Hexia?
To create a trends chart, simply select the categories and/or indices you want to analyze and click on. Then, you have the option to download these reports in PDF format.