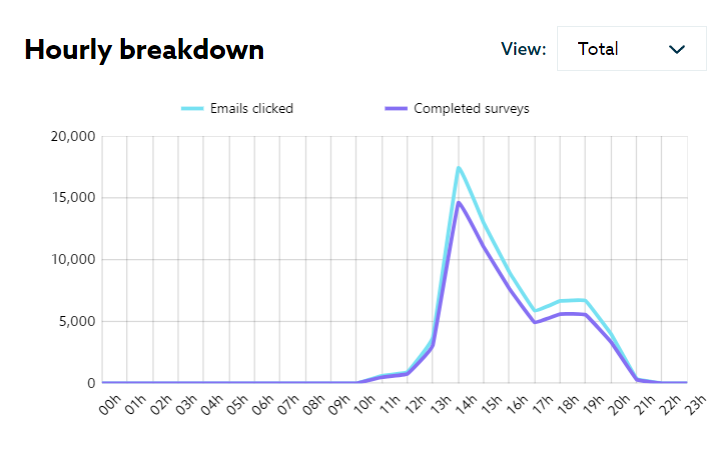
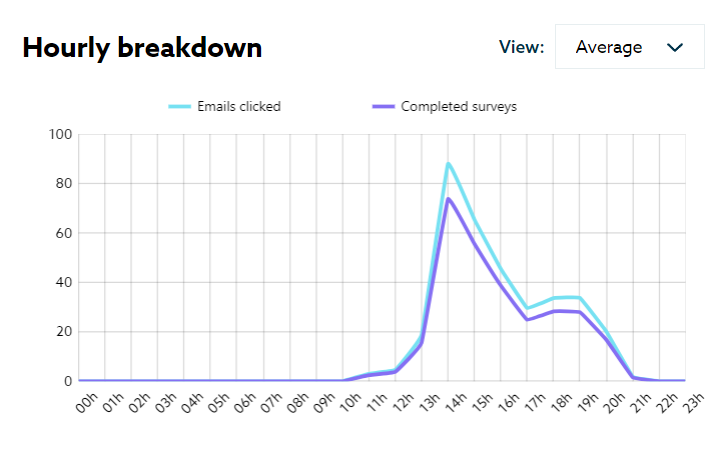
The hourly breakdown widget shows the Total and Average of emails clicked vs completed surveys per hour.
The selections can be changed using the widget, in the view tab the Total or the Average can be selected, furthermore when clicking on “emails clicked”, “completed surveys” or on the average chart “average count” or “average completed count” the lines on the graph can be removed by clicking on those categories to see one or see all in comparison to one another.