This performance-focused dashboard enables you to analyze and track user engagement on Google and Facebook through various metrics. Here’s how it works:
1. Parameter Selection
Users can customize the displayed data using filters located at the top of the screen:
- Service points / branches: Allows the selection of a specific location for analysis.
- Date range: Sets the analyzed period (e.g., from December 11, 2024, to March 11, 2025).
2. Sections and Analyzed Metrics
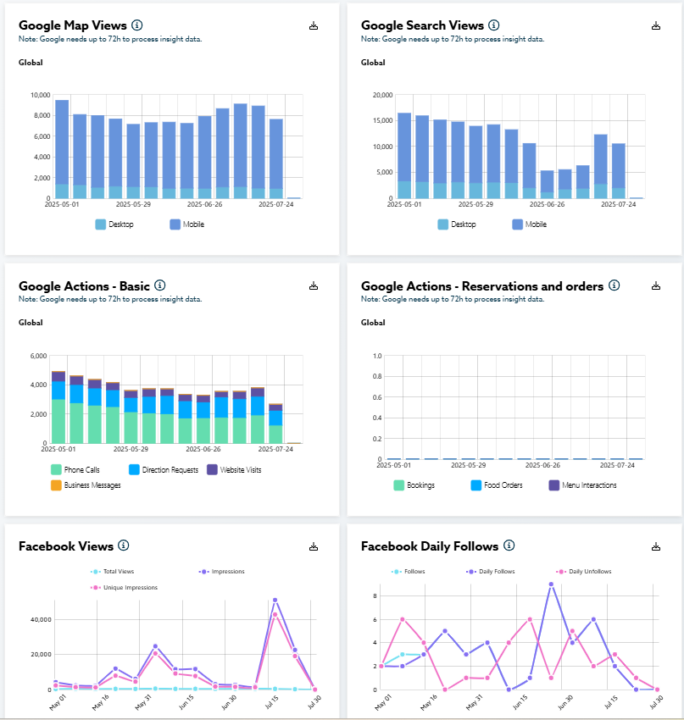
The dashboard displays different categories of data in the form of bar and line charts. For each chart, you can click on the accompanying legends to control which bars or lines are shown.
Each module includes a dropdown arrow at the top right, allowing you to download your data in Excel or CSV format.
- Google Maps Views: Shows how many times a business was viewed on Google Maps, distinguishing between desktop and mobile access.
- Google Search Views: Displays the number of times the business appeared in Google Search results, also broken down by desktop and mobile.
- Google Actions – General: Groups the actions users took after finding the business on Google, such as:
- Phone calls
- Directions requests
- Website visits
- Business messages
- Google Actions – Restaurant: Analyzes restaurant-specific interactions, including:
- Reservations
- Food orders
- Menu interactions
- Facebook Views: This chart shows how views of a Facebook page or content evolved across several indicators:
- Total views: Total number of views from all sources.
- Impressions: Number of times the content was displayed on a user’s screen, including repeated views.
- Unique impressions: Number of unique people who saw the content.
- Daily Facebook Page Follows: This section tracks follows and unfollows over time:
- Follows: Total number of new followers.
- Unique follows: Number of new unique people following the page.
- Unique unfollows: Number of unique people unfollowing the page.
- Facebook Engagement: This chart measures user interaction with the page:
- Likes: Number of “Likes” on posts.
- Unlikes: Number of times a user removed a “Like”.
- Action Clicks: Number of clicks on interactive elements (links, buttons, etc.).
3. Use and Analysis
Users can explore the graphs to identify trends, compare different time periods or service locations, and understand how customers interact with the business through Google. These insights help tailor marketing strategies and improve online visibility.
The Facebook charts allow you to track the reach and impact of posts,
Identify trends such as periods of rapid growth or follower loss,
And adjust your content strategy based on observed data—favoring formats and posts that drive the most engagement.